POYNTING Mining Simulation User Guide

Below we will explain step by step how to use the tool.
The ‘Tunnel Simulator’ was developed in response to very engaging client interaction in the Science of Circular Polarization and its propagation in Tunnels.

Circular Polarized Electromagnetic Radiation/Conduction has been used for quite some time, but POYNTING engaged a Mining Client some time ago and refined the use of this method to add additional Circular Polarized Antennas to its wide range of Antennas including some earlier Circular Polarized Antennas.

Electromagnetic Propagation using Circular Polarization has proven to have major advantages over Linear Polarization in any type of Tunnel. In particular, when using Routers with MIMO capability, we found that ‘Lefthand’- and ‘Righthand’ Polarization proved to have major advantages given the multiple reflections of the Electromagnetic Wave off the Side Walls-, Roof- and Floor of the Tunnel.
The ‘Tunnel Simulator’ takes the below physical characteristics/parameters
into account.

These have proven to be the main characteristics/parameters governing the reception of the Electromagnetic Wave by the receiving Router.
Tunnel Definition
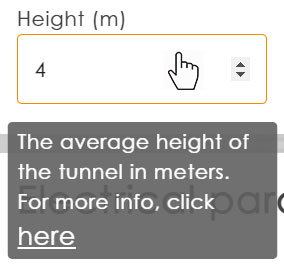
When the tunnel simulator starts UP you are presented with the ‘Tunnel Definition’ first… to get help on any of the parameters. ‘hover over’ (Figure 1) any of the parameters and click on ‘Click here’ to over the FAQ section which will explain all the parameters to be considered for the Tunnel simulation – a 2nd ‘Tab’ (a new tab in your browser) will open with the ‘Page’ detailing all the explanations of the different parameters.

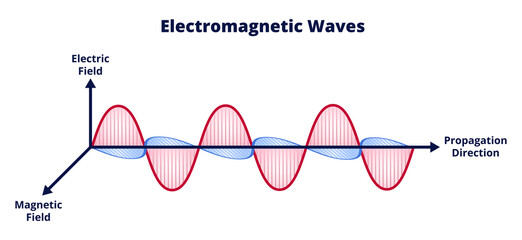
Clicking on the parameter name will open the explanation of the effect and/or the relevance of the parameter on the circular polarized electromagnetic wave propagating Down the Tunnel.

  1. Height and Width are self-explanatory.

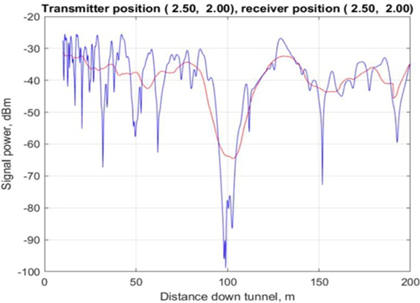
  2. Length of the Tunnel could be either where the 2nd Antenna would be located or the ‘Total Length’ of the tunnel; the ‘Signal Strength’ can be ‘read’ anywhere along the length of the tunnel.

Electrical Parameters

Conductivity

Conductivity of the walls of the Tunnel are next; these are given in ‘S’ = ‘Siemens/meter’; please note that the Graphic in the FAQ section depicts the values of the various substances in mS/m, that is ‘milliSIemens/meter’. It is the ‘ability’ of the substance (of the Walls of the Tunnel) to conduct electricity.

Relative Permittivity

Relative Permittivity of the walls is a measure of the polarizability of a substance, in this case the Walls of the Tunnel. This is expressed as a number denoted as a value of ‘Dielectric Constant’. The graph shows the values on a scale of 1 to 100; please note that the scale is logarithmic therefore this value rarely goes above 50; the value of Clay, which retains the most H2O peaks at between 35 and 40.

Roughness

Roughness of the walls is the RMS (Root Mean Square) in mm value of the ‘Roughness’ of the walls. It is suggested that if one needs a ore accurate number for ‘roughness’, one could measure a ‘typical’ wall of the Tunnel system at say intervals of 10m down the Tunnel for the ‘Distance’ under evaluation and then find the RMS value of the height of the ‘indentations’ of the walls.

Tilt

Tilt of the Walls, as mentioned in the FAQ is an estimation of the angle of the Tunnel (estimate looking at the ‘floor’) relative to the Horizontal.
Link Parameters
The ‘Link Parameters’ are divided in Transmitter and Receiver and the FAQ descriptions of these parameters are self-explanatory.

  1. Transmitter and Receiver ‘Distance from the Wall’ guidelines are at least 1 x Wavelength away from the wall on either side of the tunnel and are shown in the Table below for Frequencies 2,4 GHz and 5,8GHz.

  2. When deploying individual Circular Polarised Antennas, the separation guidelines between Antennas are as per Table shown below for the Frequencies 2,4 GHz and 5,8 GHz.


  1. Using A-BRKT-045V2-01 or A-BRKT-047-V1-01 the separation guidelines for the longer wavelength i.e. 2,4 GHz are followed for Antenna separation.

The ‘Receiver Parameters’ has an entry for the ‘Minimum Acceptable Received Signal Strength’ measured in dBm.
In addition to the explanation under FAQ, the following:
Frequency Bands (MHz) 2400 MHz 5800 MHZ
1 x Wavelength 12 cm / 5” 5 cm / 2”
3 x Wavelength 37 cm / 15” 16 cm / 6”

  1. This will be determined by the receiver sensitivity of the Receiver as stated in FAQ

  2. A typical figure for receiver sensitivity at 2400MHz is -96dBm.

  3. The modulation characteristics of the radio channel will determine what level of SNR (Signal-to-Noise-Ratio) would be required to still demodulate a good signal; a rule-of-thumb would be SNR=20dB which means, in this case, a minimum acceptable signal strength would be -76dBm. Please do your own calculations to determine what this should be.

Results
(These results will also be sent as a .pdf document to an email address of your choice)

a. Plot1: Signal Strength vs Distance Down Tunnel.


  1. The results show the Signal Strength in Blue and the Average Signal Strength in Red as per the example below.

  2. Positioning the cursor will show (Figure 3):

    • Distance Down the Tunnel (‘Black’ marker)

    • Signal Strength in dBm as Orange Line/Marker

    • Average Signal Strength in dBm as Blue Line/Marker

Figure 3
Figure 4

b. Plot 2: Cross Sectional Power Density


  1. The results show the Cross Section Power Density in Blue to White Shaded ‘Heat Map’ – the Legend on the right-hand side explains the Power Density measured in dBm.

  2. Positioning the cursor will show (Figure 4):

    • Power Density ‘across’ the Tunnel (x-coordinate) and

    • Power Density ‘top-to-bottom’ of the Tunnel (y-coordinate)

    • The Power Density at the position of the cursor in dBm (z-coordinate).

c. Plot 3: Three-Dimensional Power Density at Receiver Height – Signal Strength Across Tunnel.


  1. The results are shown, as per the example below, as a ‘heat map’.

  2. The transmitter is in a fixed position

  3. The screenshot below shows the cursor ‘hovering’ over an area in the ‘heat map’ – refer to the ‘heat map’ below (Figure 5).

    • Receiver is 2m above ground (middle of the Tunnel).

    • Receiver is offset by 0,325m and 188,4848m down the Tunnel.

    • Receive Level is -35,94942 dBm.

    • Receiver is offset by 0,325m and 188,4848m down the Tunnel.

Figure 5
Figure 4

d. Plot 4: Polarisation Performance Comparison.


  1. The results are shown for different polarizations Down the Tunnel.

  2. The transmitter is in a fixed position.

  3. Receiver is 2m above ground (middle of the Tunnel).

© POYNTING 1997 - 2024 | Designed & Developed by POYNTING Antennas (Pty) Ltd
Compare Products